Self-Hosted Application Health Checks: What Should “Healthy” Actually Mean?
A practical framework for defining health checks that reflect real user outcomes, distinguish startup, liveness and readiness, and account for dependencies without turning every external fault into an application outage.
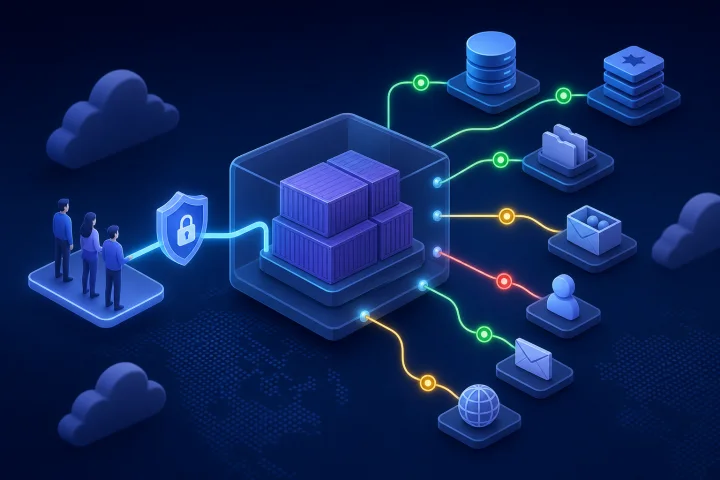
Why a reachable URL is not necessarily a healthy application
A browser reaching an HTTPS URL and receiving HTTP 200 is useful evidence, but it is not a complete definition of health. It may prove that a route, proxy, or application handler answered one request. It does not necessarily prove that users can sign in, read current data, save changes, upload files, send work to a queue, or use a required integration.
The reverse mistake is also common: treating a failed connection to any dependency as proof that the whole application is unavailable. A temporarily unreachable optional API might affect one feature while users can still perform their most important work. A useful health-check design distinguishes these cases instead of reducing every condition to one green or red light.
Docker makes this distinction explicit: a container can be running while a web server inside it is stuck and unable to handle new connections. Kubernetes similarly separates probes intended to establish whether an application has started, whether it should be restarted, and whether it should receive traffic. Those concepts provide a sound starting vocabulary, but the right checks still depend on each application’s documented behavior and your own tested workflows.
- A URL check can establish external reachability, not complete service capability.
- A running container or process is an operational clue, not proof of user readiness.
- A dependency failure must be classified by its effect on real workflows.
- The best definition of healthy is specific: the intended work can be completed within the boundaries you have chosen to monitor.

Ask three different questions: startup, liveness, and readiness
Do not ask a single check to answer every operational question. Kubernetes documents three distinct probe types. A startup probe establishes whether the application in a container has started; when configured, it prevents liveness and readiness probing until it succeeds. This is important for applications that need time to initialize before normal operation can be judged.
A liveness signal answers whether the running application is still making progress well enough that a restart may be appropriate. Kubernetes describes liveness probes as a way to decide when to restart a container and uses a deadlock as an example: the process exists, but it cannot make progress. Because a faulty liveness check can restart containers under load and contribute to cascading failures, it should be deliberately narrow and conservative.
A readiness signal answers whether the application can currently accept the traffic you intend to send it. Kubernetes notes that readiness can reflect temporary faults or overload and that a failed readiness probe stops matching Services from sending traffic to the affected Pod. In a self-hosted environment without Kubernetes, the mechanics differ, but the decision remains useful: should users or upstream systems be directed to this instance right now?
- Startup: Has initialization completed sufficiently for normal checks to begin?
- Liveness: Is the application process making progress, or is intervention such as restart warranted?
- Readiness: Can this instance safely receive its intended traffic now?
- User-facing availability: Can an external user complete a representative, permitted action?
- Dependency health: Are the services required by critical workflows responding as expected?

Start with user journeys, not endpoints
The most reliable way to define self-hosted application health checks is to begin with outcomes users need, rather than with whichever endpoint is easiest to request. List the journeys that matter for the specific instance. A publishing site may prioritize public page delivery and editorial updates. A CRM may prioritize sign-in, record search, record creation, and outbound communication. An AI application may need sign-in, retrieval or model requests, file ingestion, and background processing.
For every journey, describe the smallest safe test that demonstrates it is working. A test should avoid changing production data unnecessarily, exposing credentials, or generating unwanted external actions. If the application’s documentation does not establish a suitable endpoint, command, or test account workflow, treat that as uncertainty to resolve through vendor documentation and controlled testing—not as permission to assume that a generic URL proves readiness.
Not every journey belongs in the same alert. A failure to create records is different from an optional analytics integration being unavailable. The point is to make that distinction visible before an incident forces responders to make it under pressure.
- Sign-in: Can an authorized user establish a session through the intended identity path?
- Data reads: Can users retrieve the records, pages, or results they need?
- Writes: Can a permitted user create or update a representative item?
- Uploads and storage: Can the application accept and retrieve a test object where this is critical?
- Background processing: Are queued or scheduled tasks completing when the workflow depends on them?
- Integrations: Can a required identity, email, payment, AI, or external API interaction complete?
Map the components behind each critical journey
A journey fails through a chain, not a single application process. Map the direct components that participate in each critical workflow: the application process, database, cache, persistent storage, queue or worker, identity service, email path, and external APIs. Google’s SRE Workbook recommends monitoring direct dependencies because they can change or have problems even when the application itself has not changed.
This map makes checks more diagnostic. If public access is failing but the application’s internal operational check succeeds, investigate routing, DNS, TLS, or the path between the user and application. If the application is reachable but a write test fails, inspect the database, storage, permissions, capacity, or queue path relevant to that write. The health signal should help responders narrow the next question, not merely announce that something is wrong.
Also include resources with hard or practical limits. Google’s SRE guidance calls out RAM, disk, CPU quota, file descriptors, threads, queue waiting time, and log volume. Resource monitoring does not replace workflow checks, but it can reveal an approaching failure before a critical journey breaks.
- For each workflow, record direct dependencies and the direction of impact.
- Identify whether each dependency is internal, managed by another team, or external.
- Record the relevant resource limits and how responders can inspect them.
- Identify the smallest set of signals needed to distinguish common failure paths.
Choose shallow liveness checks and limited readiness checks
A liveness check should usually establish that the application itself can respond or make progress, without making it hostage to every downstream service. Its purpose is not to certify every business function; it is to avoid leaving a genuinely stuck application running indefinitely. Where an application publishes a documented liveness endpoint or health command, use the documentation as the starting point and test its actual behavior in your environment.
Readiness may appropriately be deeper. Kubernetes documents a pattern for applications with strict back-end dependencies: liveness can cover the application itself while readiness also checks required back-end services, preventing traffic from reaching instances that can only return errors. The word required matters. Include a dependency in readiness when its absence prevents the intended traffic from succeeding, not simply because it exists.
Keep deep checks bounded. A readiness check that performs a costly query, writes production records, or calls every third-party API can create load, noisy failures, and ambiguous results. Prefer a limited, representative verification aligned with the check’s purpose. If the application offers no documented health interface, use a carefully designed external workflow check and document its constraints.
- Use documented application health endpoints or commands only after verifying their semantics for the deployed application.
- Keep liveness focused on application progress and safe restart decisions.
- Add a dependency to readiness only when that dependency is necessary for the traffic being admitted.
- Avoid expensive, destructive, or broad fan-out tests in frequent checks.
- Use multiple focused signals rather than one oversized health endpoint whenever that produces clearer decisions.
Define a dependency policy before failures occur
For each dependency, decide its operational class in advance. A blocking dependency means users cannot complete a critical workflow without it. A degrading dependency means a feature is impaired but the application can still provide its primary service. An alert-only dependency merits attention but should not change the application’s user-facing availability state by itself.
This policy prevents two damaging extremes. Port-only monitoring misses a system that accepts connections but cannot perform useful work. On the other hand, an all-or-nothing readiness check can declare an application unavailable whenever an optional service is slow or temporarily unreachable. Both create poor incident decisions: the first produces false confidence, while the second produces unnecessary outages and alert fatigue.
The policy should state the consequence, not only the check. If a dependency is blocking, decide whether traffic should be withheld, the affected feature should be clearly unavailable, or a recovery action is required. If it is degrading, define how users and responders recognize the reduced mode. If it is alert-only, identify who owns follow-up and why it does not block the critical workflow.
- Blocking: Failure prevents a named critical workflow; it may make the instance not ready for its intended traffic.
- Degrading: Failure affects a defined feature; alert and communicate the limitation without declaring the entire application down.
- Alert-only: Failure requires investigation but does not currently affect the selected service outcome.
- Unknown: Dependency behavior has not been documented or tested; do not silently classify it as optional.
Separate public checks from internal operational checks
External and internal checks answer different questions. Google SRE describes black-box monitoring as testing externally visible behavior as a user would see it, while white-box monitoring uses information exposed from inside the system. Both are valuable for self-hosted applications.
A public check can verify that the intended domain, route, TLS path, and basic application response are available from outside. An authenticated synthetic workflow can validate a carefully selected user journey, provided credentials, test data, and side effects are managed safely. Internal checks can reveal container health, application diagnostics, dependency connections, queue depth or worker behavior, and resource pressure.
Do not expose operational endpoints publicly merely for convenience. Decide which diagnostics require authentication or private network access, and avoid placing secrets in URLs, logs, or simplistic monitor configurations. Your access model, data handling, and governance requirements remain application-owner responsibilities even when infrastructure operations are managed by another provider.
- Public: Is the intended user entry point reachable and behaving as expected?
- Authenticated external: Can a controlled account complete a critical, safe workflow?
- Internal application: Is the application reporting the expected operational condition?
- Dependency and resource: Are required services and constrained resources in a condition that supports the workflow?
- Security review: Are health endpoints, credentials, logs, and test data appropriately protected?
Turn signals into an alert and recovery plan
A check without a response decision is only a measurement. For every signal, define an owner, check frequency, timeout, number of failed observations before alerting, alert route, and escalation decision. Docker health checks provide controls for interval, timeout, initialization period, and consecutive failures; those controls illustrate why a single failed observation should not automatically carry the same meaning as a sustained condition. The appropriate values are application-specific and should be selected from observed behavior, not copied as universal thresholds.
Make the recovery path equally explicit. Record what a responder should inspect first, which actions are safe, and what evidence justifies a restart, restoration, configuration correction, or rollback. Kubernetes cautions that incorrectly implemented liveness probes can cause cascading failures through restarts under load. The same operational principle applies outside Kubernetes: automated recovery should be narrow, understood, and tested rather than a reflexive response to any failed dependency.
Useful diagnostics include the externally observed result, application and container health state where available, recent health-check output, direct dependency responses, and relevant resource conditions. Docker documents that configured health status is visible through container status and that health-check diagnostic output can be queried for investigation. Preserve enough context for the on-call person to act without guessing.
- Signal owner: Who owns the check configuration and its runbook?
- Observation policy: How often does it run, how long can it take, and how many failures constitute a meaningful condition?
- Alert route: Who is notified, and which conditions warrant immediate escalation?
- First inspection: Which logs, health output, dependency checks, and resource indicators should be reviewed?
- Safe actions: Which restart, configuration, restoration, or rollback actions are approved?
- Escalation boundary: When does the issue require an application owner, dependency owner, or provider involvement?
Frequently asked questions
Is an HTTP 200 response enough for a self-hosted application health check?
Usually not. It can demonstrate that a reachable route returned a response, but it may not prove that users can sign in, access current data, save changes, use storage, complete background work, or reach required integrations. Pair a basic external check with checks that reflect the critical workflows for that application.
What is the difference between liveness and readiness?
Liveness asks whether a running application is making progress or may need restarting. Readiness asks whether it can safely receive intended traffic now. Kubernetes documents different consequences: failed readiness stops matching Services from sending traffic, while failed liveness can lead to container termination under the configured restart policy.
Should a readiness check fail when an external API is unavailable?
Only if that API is required for the traffic or workflow the readiness signal represents. If users cannot complete a critical function without it, it may be a blocking dependency. If it affects an optional feature, classify it as degrading or alert-only instead, and define the user and responder experience explicitly.
What should be tested before relying on health checks?
Test meaningful failure scenarios in a controlled manner: a stopped application process, unavailable database, exhausted storage, failed queue worker, and unreachable external dependency. Confirm the observed signal, traffic behavior, alert route, diagnostics, safe recovery action, and restoration criteria for each scenario.
How does Airbip fit into self-hosted application monitoring?
Airbip manages deployment of catalog applications as Docker workloads on its cloud servers and provides infrastructure capabilities including routing and TLS automation, DNS checks, service lifecycle management, and configurable daily, weekly, and monthly backups. Application owners still need to define critical workflows, make access and integration choices, understand application-specific health behavior, and set recovery priorities.
Sources and further reading
- Liveness, Readiness, and Startup Probes — Kubernetes
- Dockerfile reference: HEALTHCHECK — Docker
- Running containers: Healthchecks — Docker
- Monitoring Distributed Systems — Google SRE
- Monitoring — Google SRE Workbook
- Testing for Reliability — Google SRE